
Fundamentals
Information that can help you manage the storage environment for preservation.
- Standards
- Environment
- Dew Point
- Mechanical Systems
- Loggers
- Preservation Metrics
- Outdoor Data
- Team Approach
- Reduce Risk
Current Research on Managing the Storage Environment for Preservation
A close reading of the literature of conservation will reveal that the creators of the unwavering 70°F/50% RH recommendations regarded their suggestions as provisional pending closer study. The evolution away from such simple ideas and toward a more modern view incorporates research undertaken over the last twenty-five years or more.
The Smithsonian’s Museum Conservation Institute has done a great deal to clarify how moisture content affects the mechanical properties of cultural heritage objects. Their work shows that extremes of dryness and dampness pose the greatest risk of physical damage. That statement contains one of the most significant differences between old thinking and new thinking. We’re now concerned much more with what poses the greatest threat (that is, in identifying the circumstances we need to avoid) than we are with articulating an ideal.
IPI investigated the impact of cycling temperature and humidity conditions on library collections in the late 1990s in order to determine if environmental fluctuations were inherently damaging to collection materials and to what extent and how quickly the collections felt changes in temperature and humidity. These studies confirmed that material response to changes in temperature (thermal equilibration) is fast, taking only hours, as compared to the response to changes in humidity (moisture equilibration), which may take days, weeks, or months.
The Library of Congress Research Division, IPI, and other preservation science laboratories conducted extensive accelerated aging projects in order to explore and clarify the effect of environment over time on the chemical decay rate of materials such as plastics, dyes, paper, leather, and textiles.
Overall, a great deal has been learned about managing the storage environment in collecting institutions. The accepted norm—that temperatures should be steady and unwavering at human comfort levels, and that short-term fluctuations in relative humidity matter more than long-term trends—is now regarded by preservation scientists as outmoded and counter-productive. Environments are complicated. The simple notion of setting targets for an 'ideal' environment and watching for daily or weekly excursions is the wrong approach. It is much more important to manage the extremes of heat and moisture.
The Effect of Temperature on Material Decay
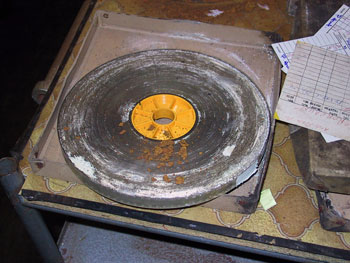 At high temperatures (generally above 75°F) chemical reactions, or the rate of "natural aging", increases. Magnetic media, plastics, film, leather, rubber, dyes, and acidic paper are particularly vulnerable. Environmentally-induced damage can include deformation, shrinkage, sagging, melting, stickiness, fading, embrittlement, and adhesive failure.
- Biological activity increases at warmer temperatures—insects will eat more and breed faster, mold will grow faster within certain temperature ranges.
- In general low temperatures are good for preservation, provided that they don't result in dangerously high RH.
- Some materials are sensitive to low temperatures (below 50°F), particularly polymers found in modern paints and coatings, vulnerable rubber and plastic objects. Temperatures that are too low can cause desiccation, which results in fractures of paints, adhesives, and other polymers.
- Wide and frequent fluctuations in temperature can cause fractures and delamination in brittle, solid materials. Furniture, ivory, and oil paintings are particularly vulnerable.
The Effect of Relative Humidity on Material Decay
- Dampness (relative humidity over 65%) can result in mold, metal corrosion, and dye bleed in vulnerable collections. High humidity also causes swelling and warping of wood and ivory, buckling of paper, softening of adhesives, and an increase in biological activity.
- Relative humidity above 0% supports hydrolysis that gradually disintegrates and discolors organic materials, especially materials that are chemically unstable such as pulp paper and magnetic media Dryness (low relative humidity) will cause organic materials to shrink, warp and crack; papers and textiles can become brittle.
- Fluctuating RH will shrink and swell unconstrained organic materials, crush or fracture constrained organic materials, cause layered organic materials to delaminate and/or buckle, and loosen joints in organic components.
Thermal Equilibration – Adjusting to Temperature Change
- Material response to changes in temperature, called thermal equilibration, occurs relatively quickly compared to the response to changes in RH. Most materials will adjust to the temperature of a new environment in a matter of hours. The time needed to adjust to a new temperature condition is influenced by the amount of exposed surface area and the thermal mass of the object.
- Sustained high temperatures have a much more significant impact on the stability of collection materials than do temporary spikes or wide fluctuations of temperature.
Moisture Equilibration – Adjusting to Changes in Relative Humidity
Material response to changes in relative humidity, called moisture equilibration, occurs relatively slowly compared to the response to changes in temperature. All of the materials tested by IPI (without enclosures) reached moisture equilibration in a matter of days or weeks, as opposed to hours for thermal equilibration. The process of moisture equilibration is more complex than that of thermal equilibration. Several variables determine the length of time it takes an object to equilibrate—including its size, the amount of surface exposure, object enclosures and temperature. Finally, there is more variation in the capacity of individual objects to control moisture equilibration than thermal equilibration.
Periods of sustained high humidity in the summer and sustained low humidity in the winter are much more significant in terms of preservation than sudden or short term fluctuations in relative humidity.
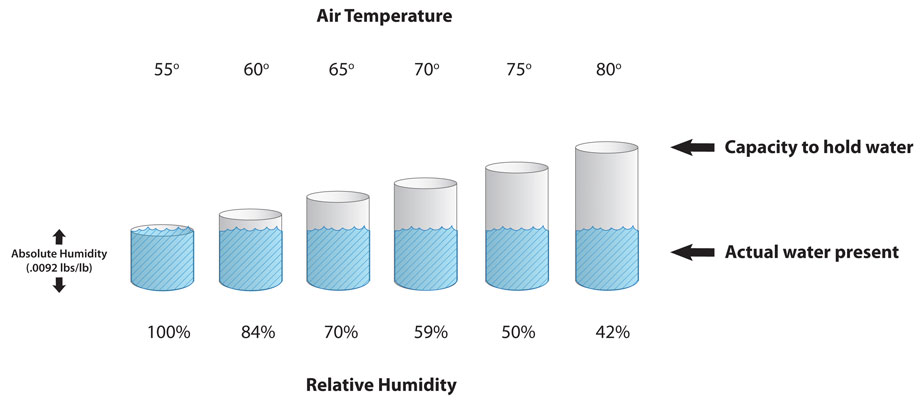
The Importance of Dew Point
Controlling the moisture content of the air—the dew point—is key to managing the risk of material decay.
Dew Point is a measure of the absolute amount of water in the air. Dew point is also the temperature at which the air cannot hold all the moisture in it and water condenses. As air is circulated into and around a building, its absolute moisture content—and therefore its dew point—does not change unless it is humidified or dehumidified. In other words, unless the mechanical systems add or remove water from the air, the outdoor dew point and the indoor dew point will be the same.
Temperature, Relative Humidity, and Dew Point are Interrelated Variables The dew point determines what combinations of temperature and RH will be possible in the storage environment. At a constant dew point, when the temperature goes up, the RH goes down and when the temperature goes down, the RH goes up. Therefore, the dew point is responsible for determining which temperature setting will give you which RH. Institutions that try to improve conditions by lowering storage temperatures without carefully watching the resulting RH may find that the moisture level is much too high for safe storage of vulnerable collections. You can explore this relationship using IPI's Dew Point Calculator in the Storage Planning section.
Understand Basic Mechanical System Functions
Collections care and facilities management staff should review the following questions:
- How does your system manage temperature?
- How does your system manage relative humidity?
- What is the dew point temperature throughout the year and how is it managed?
The Loop—Components of a Typical Air Handling Unit
Understanding the components of an HVAC systems is simplified if you conceive of them as a moving loop of air that enters the space, passes through it, leaves the space, returns to the place where the conditions of that air are appropriately altered (air handling unit) and returned again to the space (diagram below). It is along this loop of moving air that temperature can be raised or lowered, humidity can be added or removed, filtration can occur, and outside air can be added or removed.
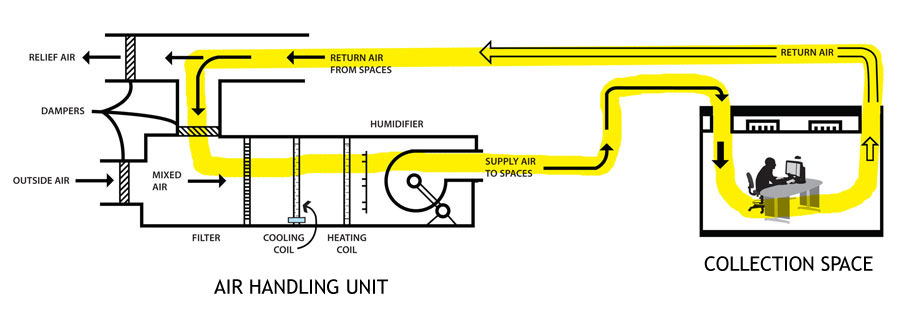
There are several typical components of an AHU, and each can alter the conditions of the moving loop of air, and ultimately the environment in the space. These include:
Supply Air Fan
The energy to move the loop of air is supplied by a fan powered by an electrical motor. It pushes the air out to the spaces through the supply air ducts and draws it back through the return air path. In some systems a second fan is employed to assist with pulling the return air back to the AHU. Most fans serving collections spaces operate at a constant speed. However, some are equipped with variable speed drives that allow you to adjust the speed at which the volume of air in a space is exchanged.
Humidification
If a sensor, usually in the return air stream, detects that the space relative humidity is too low, the humidifier injects water vapor into the supply air stream. This water vapor is typically in the form of steam that is produced by a small steam generator heated by steam, electricity, or gas.
Heating
Heating is provided to spaces by passing the stream of air over a warm heating coil and conveying that air to the space. Heating coils are controlled by a thermostat. Hot water or steam produced by the boiler (peripheral to the AHU system) allows the selected temperature to be achieved in air passing through the heating coil. On occasion heat may be introduced to a space directly using convectors or radiators.
Cooling/Dehumidifying
If a sensor in the space detects that the space is too warm, the stream of air is passed through a cold coil before being supplied to the space. The coil is cooled by a flow of cold water supplied by a remote chiller or by the evaporation of a refrigerant provided by a remote compressor/condenser unit (known as DX cooling). If the temperature of the cooling coil is below the dew point temperature of the air, moisture will condense on the coil, thereby dehumidifying the air. In cases where the desired space dew point temperature is quite low (e.g. 45°F) at least some of the air must be cooled to 45°F. Because 45°F is colder than the desired space temperature, this sub-cooled air must be reheated. Such arrangements are called sub-cool/reheat systems.
Some buildings have humidistatically controlled systems, which are designed to maintain a stable RH by manipulating and varying the temperature. A humidistat sensor adjusts the temperature up if the RH rises above a set point, and maintains it until the RH drops back. If interior RH is lower than exterior RH, dampers are opened by sensors and the air is circulated through the building. If exterior RH is too high, the dampers remain closed.
Air Filtration
Air filtration is provided by passing all air delivered to spaces through one or more filters to remove particulates. Often additional filters are added to remove gaseous components in the air. In some systems the outside air is separately filtered as it enters the system.
Mixed Air Control
As the air from the spaces returns to the AHU a portion of that air is ducted outside (through the relief air damper) to make room for the introduction of fresh air through the outside air damper. Systems are typically designed to constantly introduce 10% to 15% outside air. This outside air is blended with the bulk of the return air in the mixed air chamber.
In some systems there is no process for relief air at the AHU. Instead, a volume of air equivalent to the outside air is allowed to exfiltrate from the spaces in order to keep them positively pressurized and thus avoid the infiltration of air from surrounding spaces.
Choosing Loggers
 The Free level of eCNB is available for use with data gathered by IPI's original Preservation Environment Monitor (PEM), the PEM2, and the DBF file from IPI's Climate Notebook desktop software.
The Basic and Professional levels of eCNB will support PEM, PEM2 and Climate Notebook DBF data files, as well as data gathered by Hobo and Spectrum loggers or other data formatted as a CSV file.
The datalogger you choose will impact the most important part of the monitoring process—interpreting the data and using it to make improvements to the storage environment. A common mistake is focusing solely on the price of the logger and not comparing accuracy, reliability, and ease of use. To compare the specifications of several popular dataloggers, refer to IPI's interactive datalogger comparison chart or the September 2011 National Park Service Conserve O Gram comparison of dataloggers.
Why We Recommend IPI's PEM2
Preservation of collections requires a source of reliable environmental data. There are many ways to collect such data and by pointing out the advantages of the PEM2, IPI in no way pretends that it is the only reliable source. The PEM2 was created by preservation experts exclusively for use by collections care professionals. Its accuracy, time-saving features, long-term reliability and tight integration with IPI’s unique graphing software and Preservation Metrics® make it a better value than other devices whose initial cost advantage may prove a false economy.
The PEM2 is a superior measuring instrument with demonstrated accuracy. It has much better humidity accuracy because of the quality of the RH and temperature sensors and the fact that each PEM2 is individually calibrated on a NIST-traceable calibration device, guaranteed by a certificate issued with each logger and signed by a test technician. IPI claims a maximum % RH error of +/- 2%, but PEM2s typically perform to within 1% of the true RH reading. Less expensive loggers often have +/- 3.5 % RH maximum error and are not individually calibrated.
PEM2s are built in the USA and unlike some less expensive loggers, use industrial grade components throughout. Industrial grade parts are less likely to fail at high or low temperatures. PEM2s are green; they are made with special parts and solders that comply with international RoHS (Reduction of Hazardous Substances) specifications. You will not find mercury or lead inside a PEM2 or a “do not dispose of in trash” symbol. They also feature software compensation for low temperature that means the PEM2 can be trusted to give accurate humidity readings in cold vaults and freezers.
Other valuable aspects of the PEM2 include the time it saves and the preservation knowledge and support behind it. The PEM2 is the easiest device to launch and to retrieve data from of any datalogger—simply insert any USB flash drive. Typical once-a-month data retrieval takes a few seconds, with no fussy setup using proprietary software. PEM2 users rate this feature as their favorite. Often the time spent launching and retrieving data from inexpensive loggers using their proprietary software is quickly eaten up in staff time.
PEM2 batteries last for years and can store up to 20 years worth of data—less expensive logger batteries typically have a 1-year battery life and limited data storage. Gaps in data from less expensive loggers that originate from a combination of dead batteries and cumbersome file naming confusion undermine the very purpose of having dataloggers in the first place.
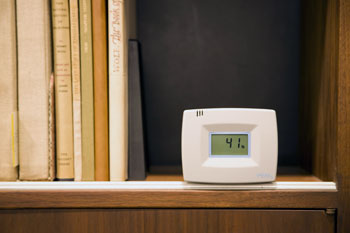
PEM2s have a display, a feature lacking in most less expensive dataloggers. Users tell IPI that displays are very useful in everyday preservation practice.
The final advantage of the PEM2 is its unparalleled customer support. IPI has a generous warranty and responds promptly to requests for technical support (ipitechsupport@rit.edu).
Adding together all of the factors, PEM2s offer superior value compared to devices that may cost less initially, but deliver fewer of the things collections care professionals need to do their job well. All these are reflections of the fact that the PEM2 was designed for one job: collecting environmental data in museums, libraries and archives.
Number and Placement of Loggers
Calculating the number of loggers you need and where to place them is not as simple as saying that you need one unit per room or that one logger will cover a specific number of cubic feet in a storage or display space. You want to do more than collect data—you want to analyze and improve the storage environment for preservation.
The factors you want to consider depend on your goals for data collection and analysis. For example:
- In a historic house, consider monitoring north and south facing rooms which receive differing amounts of heat from the sun to document heat loads that influence the temperature in the space. Document the environment at different levels in the building—hot attic spaces, damp spaces next to exterior walls, or locations near radiators or other sources of heat.
- Identify potential moisture problems by monitoring basement storage locations in historic buildings. High humidity levels may result from water leaks, wet walls and foundations from poor drainage, or high levels of ground water.
- You may want to monitor the environment in areas that hold the most important or the most vulnerable materials in the collection.
- Select areas that have different environments from others because they are served by different HVAC equipment to document the function and capabilities of each system and identify opportunities for improvement. For example, data may show the need for additional humidification or dehumidification during certain times of the year.
- There may be an area where the HVAC system does not seem to be working properly, and data regarding set points and temperature or RH fluctuations is needed for analysis.
- You may want to document stratification in a space with high ceilings or many open levels (such as library stacks or high bay storage).
- Monitor locations that have had environmental problems in the past to justify the need for improvements or to document the result of improvements that have been made.
- Lending institutions may want to see records of the storage environment in gallery spaces before approving a loan.
Whatever you decide, it is important to leave the PEM2 in the selected location for a full year so that the data you analyze covers the change of seasons (both heating and cooling seasons). Place loggers on a shelf or near cabinets where collections are stored, preferably midway between the floor and top shelf or ceiling is best. Avoid placement near outside doors, air vents, radiators, cold walls, fans, or other sources of heated, cooled, dehumidified or humidified air.
If you have several loggers, you will want to document their location for future reference. It is important to collect data routinely, although in most cases it isn’t necessary to download the data daily or even weekly—every few months is usually fine.
Finally, it is important to work with your facilities management staff to understand the functions and capabilities of your mechanical system and to identify any possibilities for improving the environment for long term collection preservation.
Preservation Metrics
Recognizing the need for a way to transform data into tools that are applicable to management of the environment for preservation, IPI developed Preservation Metrics®.
Preservation Metrics transform temperature and relative humidity data into quantitative numerical measures of collection decay risk. IPI developed metrics for chemical change in organic objects, dimensional change or mechanical damage, the potential for biological decay or mold risk, and moisture-induced corrosion. Each metric evaluates the quality of environments over a period of time into a single value representing the degree of risk for a particular form of material decay, taking into account all the ups and downs of T and RH during the monitoring period. To use the metrics effectively, you simply need to understand what forms of decay they address and what the numeric values tell you about the preservation quality of the space.
IPI's Preservation Metrics were developed to provide quick, automated analysis of environmentally-induced decay. They allow you to accurately and objectively determine how well each storage area is performing for collection preservation, how well one environment is performing compared to another, and how various collection materials are faring in a particular location. Metrics can flag potential problems and document the impact of changes or adjustments made to improve conditions. Analysis based on metrics can be used to argue for funding or other resources needed to make improvements in storage conditions. For a handout on the metrics, download this PDF.
|
Type of Decay: Chemical/Natural Aging |
|||||||||
|
Metric Used: |
|
||||||||
|
Interpretation:
Measures:
Role of Environment: Vulnerable Materials: All organic materials (paper, textiles, wood, vellum, plastics, dyes, leather, fur, etc). The risk of Natural Aging is particularly significant for book and document collections. Examples of chemical decay include embrittlement and deterioration of pigments.
|
|||||||||
|
Type of Decay: Mechanical Damage |
|||||||||
|
Environmentally-induced physical or structural deterioration.
Metrics Used: |
|
||||||||
|
Measures: The amount of moisture in the environment and the degree of fluctuation between periods of dampness and of dryness, all of which promote mechanical or physical damage in vulnerable materials.
Role of Environment:
Vulnerable Materials |
|||||||||
|
Type of Decay: Biological/Mold Risk |
||||||||
|
Represents:
Metric Used: An MRF of 0.5 or less indicates an environment with little or no risk of biological decay. An
|
|
|||||||
|
Measures: Data is analyzed to determine if environmental conditions promote biological decay, including the growth of xerophilic mold and mildew and the risk of insect infestation. The MRF algorithm integrates over time, creating a running sum of progress toward mold germination.
Role of Environment:
Vulnerable Materials |
||||||||
|
Type of Decay: Metal Corrosion |
|||||||||
|
The risk of environmentally-induced corrosion of metals.
Metric Used: |
|
||||||||
|
Interpretation: % EMC Max indicates the maximum amount of moisture in the environment. A lower %EMC Max is better for avoiding corrosion.
Measures:
Role of Environment:
Vulnerable Materials: |
|||||||||
Use Outdoor Data in Your Analysis
The air inside your buildings came from the outside initially. The building's mechanical system, no matter how simple or complex, was designed to deal with the outside air, particularly the extremes of heat and moisture. The climate situation that mechanical systems are designed to manage will vary depending on the regional climate patterns.
Most often, the air that comes indoors in the winter is cool and dry, while in summer the air is warm and contains lots of moisture. HVAC systems are designed to modify this outdoor air to make the indoor conditions appropriate. In fact, it is the seasonal extremes that have the most significant impact on the preservation environment. Winter dryness and summer heat and humidity are the most difficult preservation environment challenges.
To mitigate extreme seasonal conditions and variations, HVAC systems can:
- Dehumidify in the summer, removing moisture from the air when the degree of relative humidity is too high.
- Humidify in the winter, adding moisture to the air when the degree of relative humidity is too low.
The dew point temperature is a significant factor in this process. As air is circulated into and around a building, its absolute moisture content, or dew point, does not change unless it is humidified or dehumidified. In other words, unless the mechanical systems add or remove water from the air, the outdoor dew point and the indoor dew point will be the same. You can determine what your mechanical system is doing to manage the moisture content of the air in the storage location by overlaying two graphs—the outdoor dew point and the dew point of the monitored location. For optimum results, review a full year of data, covering all seasons of the year. You can download outdoor data for your geographic location from NOAA on this site. The following graph illustrates what you should look for when reviewing these two graphs:
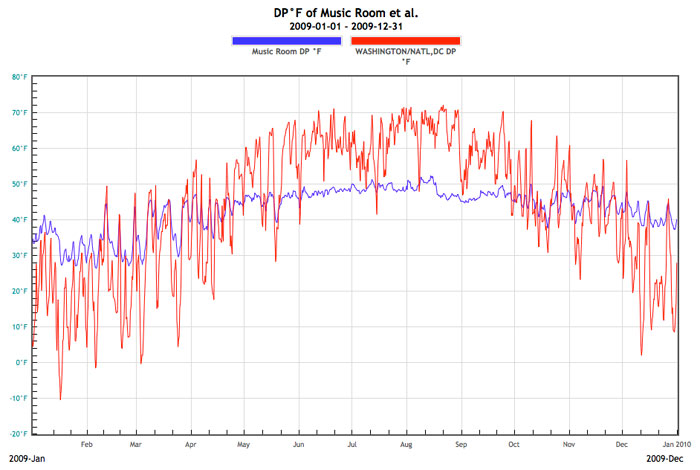
Dew Point Temperature Outdoors in Washington DC, and in one storage space for music, 2009
The outdoor dew point data is shown in red, and the indoor data is shown in blue. Although the indoor DP line is often different from the outdoor, a close examination reveals that major outdoor dips and rises usually have some influence on indoor conditions. If your mechanical systems have no capacity to humidify or dehumidify, then the indoor and outdoor lines will largely lie on top of each other. That is not the case with this example.
In the winter months, the outdoor DP’s are fairly low, much too low to provide an appropriate RH when the air is heated to room temperature. The indoor DP’s are higher, moving around a bit but mainly staying in the range of 30-40°F. This indicates that the mechanical system serving this space is humidifying the air. There are periods during the ‘transition’ months (March and April, and October and November) when the indoor and outdoor DP lines are essentially on top of each other, and near the desired range of 35-45°F. During these times, no humidification or dehumidification is apparently going on, nor is any necessary—but just in case it might be, this would be a good time to check that energy is not being wasted by the systems acting like they do during the summer, sub-cooling and re-heating air to remove moisture that isn’t really there in the first place. Such unnecessary work done on outside air can add up to very significant energy costs.
In the summer months (May through September in this location) outdoor dew points are consistently higher than indoors, indicating that dehumidification is taking place. The blue line shows that indoor dew points average near the high 40°s and are relatively well controlled within a narrow range. When the indoor summer dew point line is fairly flat, that is evidence that the climate control system is asserting control and regulating the indoor dew point. From the preservation point of view, this is good news, because in many cases properly managing the indoor summer dew point is the key to achieving a high annual TWPI. In preservation, cooler and drier is better, and a low summer dew point allows the environment manager to have both cool temperatures and moderately low RH’s, which will improve the TWPI.
Looking at the full year of data you can see that the mechanical system in this space is working to maintain the RH between 30% and 50%.
 Managing the environment for preservation has an effect on the fiscal health and everyday working life of the institution. The capital outlay, increasing energy costs, and other operating expenses associated with providing heating, cooling, and ventilation have a significant impact on institutional budgets. At the same time, the value of institutional collections cannot be overstated and the responsibility to provide adequate stewardship is primary. An effective solution to managing the environment to achieve both collection preservation and energy efficiency can only be achieved if environmental management is a team effort. IPI’s experience has shown that most institutions can improve the preservation of collections and contain energy costs when the right people work together to understand, evaluate, and improve the environment in their institution.
In order to make changes to the current environment that truly have an impact, it's important to include people who affect and create the storage environment in the process. We recommend a cross-functional team with at least one permanent representative from collection care (conservation, collection management, curatorial, preservation), and one or more from facilities (engineers, building operators, facility management). You may also need someone in an administrative capacity on the team. Often large institutions or college campuses have someone assigned to sustainability and energy savings, and this person should be asked to join the team. These individuals should be considered representatives of their co-workers and areas of responsibility, with an obligation to present their concerns and report back on team discussions and decisions.
The work of the Environmental Management Team should be considered an ongoing activity, ideally with someone assigned as a champion of the task and with long-term administrative support. Representatives from Facilities bring their knowledge of building operations, and mechanical system functions and capabilities. Collections representatives have generally monitored the environment and have collected data to review, and know where the most vulnerable materials are stored. The Administrative team member should be someone who can affect activities within the storage area, can enforce changes in routines or functions as needed, and can get funding for equipment if needed.
The Environmental Management Team should develop a collaborative approach to managing the environment, sharing information, and negotiating an optimal environment for preservation.
We define an optimal and sustainable preservation environment as one that is:
- Best for the collections in your institution
- Achievable given your regional climate, your building and its mechanical system
- Acceptable to the occupants of the space
- The least energy-consuming
General Strategies to Reduce the Risk of Decay and Improve the Storage Environment for Preservation
- Use IPI's Preservation Metrics® (PI, TWPI, MRF, %EMC, %DC) along with your review of temperature and RH data graphs. The metrics define specific decay risks and provide quantitative feedback to incrementally improve the environment for preservation.
- Acquire and maintain long-term environmental data. The historical performance of a mechanical system is helpful in diagnosing current problems. It provides clear evidence of what the systems have been capable of in the past. Such evidence, for good or ill, is very useful when changes in mechanical systems are planned.
- Dew point, which is an indication of the absolute moisture content of air, is the key to understanding and controlling the RH of storage and gallery spaces. The importance of understanding dew point cannot be overemphasized. Building engineers often do not need to measure (or even understand) dew point in order to operate mechanical systems, but it is essential for conservation and preservation professionals to do so.
- Use the Dew Point Calculator to learn how dew point, temperature, and RH interrelate. Find out the capabilities of your mechanical system to lower the dew point (dehumidify) or raise the dew point (humidify) and look at the graphs and metrics to determine if more needs to be done to achieve the desired dew point.
What can I do to improve the environment in a location with a RISK rating?
Reduce the RISK of Natural Aging:
- Both temperature and relative humidity play a role in determining the natural aging rate, which is measured with the TWPI metric (higher TWPI values are better).
- The most effective way to reduce the natural aging rate is to reduce the average temperature while avoiding too high or too low RH. In winter, avoid overheating. In the summer and fall, avoid periods of high relative humidity.
- In many situations the key to reducing the risk of natural aging (and raising the TWPI) is to more effectively dehumidify in the summer. Sometimes changes in the temperature setting can be used to raise or lower RH to more appropriate levels. Review your dew point graph and use the Dew Point Calculator to determine the best solution for your particular situation.
Reduce the RISK of Mechanical Damage:
- A mechanical damage risk can be due to damp conditions, dry conditions, or wide fluctuations between these extremes. Any one or all three of these factors may produce risk.
- The magnitude of mechanical risk is measured using two metrics—%EMC and %DC. The former is used to represent the degree of dryness and dampness and the latter represents the magnitude of expansion/contraction caused by changes in RH.
- To improve conditions, the first thing to do is determine which of the three types of risk—dryness, dampness, or fluctuation—is causing the risk indication. Look at the %EMC Min, %EMC Max, and %DC metrics to see which ones are outside the safe boundaries. The metric values will show in red in the Statistics, Risks & Metrics, and Compare tables.
RISK due to DRY Conditions:
- The magnitude of risk due to dryness (a prolonged period of low RH) is measured by the %EMC Min. When this value is below 5 %EMC—corresponding to an average RH of about 20% over a month's time—a mechanical risk exists for many types of hygroscopic (water-absorbing) materials.
- To eliminate this type of risk, either humidify the air or lower the temperature using the Dew Point Calculator to estimate how low the temperature must go to raise the RH to desired levels.
RISK due to DAMP Conditions:
- The magnitude of risk due to dampness (a prolonged period of high RH) is measured by the %EMC Max. When this value is above 12.5 %EMC—corresponding to an average RH of about 68% over a month's time—a mechanical risk exists.
- To eliminate this type of risk—an especially dangerous one because the risk of mold growth and an increased rate of natural aging also accompany dampness—either dehumidify the air or raise the temperature. Once again, use the Dew Point Calculator to understand the possible combinations of temperature and dew point that would reduce the RH to safe levels.
RISK due to FLUCTUATING Conditions:
- Risks arising from excursions between dry and damp conditions are measured by the %DC. Most materials that absorb and release moisture from the air undergo dimensional change (expansion and contraction) when they experience extremes of dryness and dampness.
- The magnitude of risk due to fluctuating conditions is a fraction of how big the difference is in an object's moisture content between the driest point and the dampest point. When the maximum %DC value exceeds 1.5%, a fluctuation risk exists.
- To eliminate this type of risk use humidification to reduce the degree of dryness or dehumidification to reduce the degree of dampness.
To eliminate mechanical risks of all types, a review of the dew point graph will help you understand how the air's moisture content is changing over time. Usually the periods of time when the dew point is highest or lowest will correspond to the times when RH is high or low. More effective humidification in winter or dehumidification in summer can reduce mechanical risks. Sometimes alterations in temperature can be used to raise or lower RH during critical periods.
Reduce the RISK of Mold Growth:
- The risk of mold growth is indicated by the MRF metric. Fungal organisms require high levels of RH to germinate and grow. Mold may occur when general room conditions have high RH levels or when there is a localized source of moisture such as a leaky pipe or roof.
- To reduce the risk of mold, lower the RH to 65% or lower and maintain it at that level.
- Periods of mold-inducing RH may be eliminated by dehumidification or, in certain cases, by temporarily raising the temperature to reduce the RH. Use the Dew Point Calculator to explore scenarios for effective temperature/RH combinations.
- One common mistake that increases the mold risk is to lower the temperature to levels that result in dangerously high RH. Review the Mold graph and note the period of time when a risk is present (usually summer and fall). Look at the DP (dew point) graph for space during the same time period and note the approximate dew point temperature. Then use the Dew Point Calculator to explore what combination of RH and temperature are available at that dew point temperature. Any temperature that results in an RH higher than 65% is inappropriate for that space during that time period.
- Note that air temperatures near supply duct grilles may be cooler than general room conditions and therefore may have a locally higher RH.
Reduce the RISK of Metal Corrosion:
- The corrosion risk for iron and other metals arises from periods when the average RH level is 55% or higher for a number of days. The metric used to measure the risk of metal corrosion is the %EMC Max. When this value is 10.5% or above, a corrosion risk is present.
- Estimating corrosion risk is complicated by many factors, including the nature of the metal, atmospheric contaminants, the presence of salts, and the temperature. When such complicating factors are known to be present, the threshold RH level and the time to corrode may be lowered.
- To reduce the risk of metal corrosion, lower the RH to 65% or lower and maintain it at that level.
- Periods of corrosion-inducing RH may be eliminated by dehumidification or by temporarily raising the temperature to reduce the RH. Use the Dew Point Calculator to explore scenarios for effective temperature/RH combinations.